
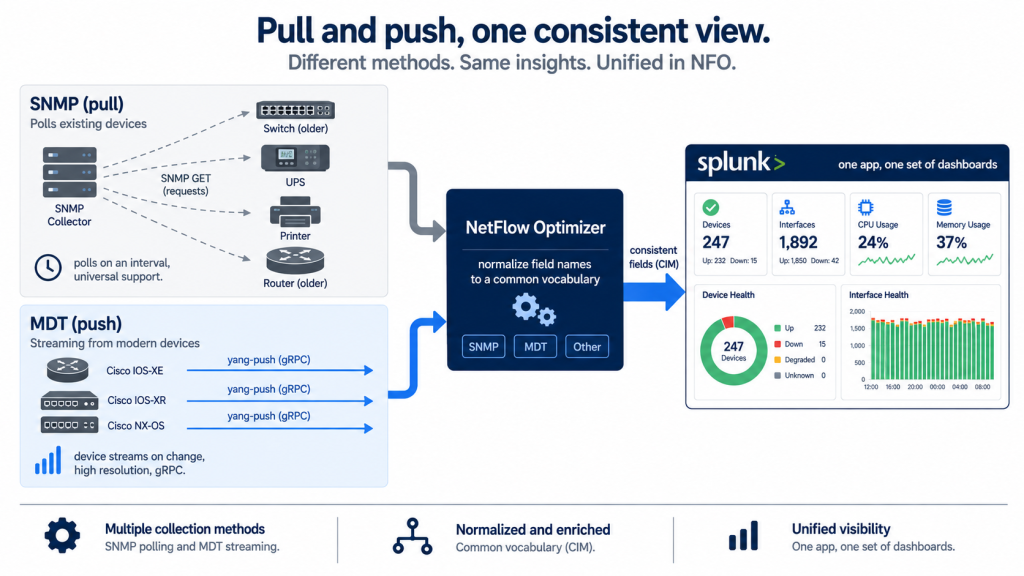
SNMP has been the workhorse of network monitoring for more than thirty years. It is universally supported, well understood, and installed on essentially every network device ever shipped. It is also showing its age. SNMP is a poll-based model: a collector asks each device for its counters on a fixed interval, one request and response at a time. As networks grow denser and faster, that polling model strains, and a newer approach has emerged to replace it for the devices that support it: Model-Driven Telemetry.
Model-Driven Telemetry (MDT) inverts the relationship. Instead of a collector pulling counters on a schedule, the device streams structured, model-based telemetry as it changes or on a defined cadence. It is higher-resolution, lower-overhead on the device, and better suited to modern high-speed platforms. It is also, increasingly, the direction Cisco and other vendors are pushing on newer hardware.
The temptation is to frame this as a migration: rip out SNMP, adopt MDT. That is the wrong frame. The right one is that you will run both for years, and the practical question is not which to choose but how to make both feed a single, consistent view. That is where NetFlow Optimizer (NFO) fits.
How MDT Differs From SNMP Polling
The core difference is pull versus push. With SNMP, the collector initiates every exchange, walking OIDs on an interval. With MDT, the device establishes a persistent connection and streams telemetry on its own, either periodically or when a value changes. That difference cascades into several practical advantages for MDT.
- Higher resolution. Streaming can deliver sub-second or on-change updates, catching microbursts and transient conditions that fall between SNMP poll intervals.
- Lower overhead at scale. A device streaming its own state is more efficient than a collector repeatedly walking large OID trees across thousands of devices.
- Structured, model-based data. MDT data is defined by YANG models, so its structure is explicit and consistent rather than a flat list of numbered OIDs.
None of this means SNMP is obsolete. It means SNMP and MDT are suited to different parts of the same network, which is exactly why the realistic answer is both.
Why You Still Need Both
MDT is the future for the devices that support it. But most estates cannot go MDT-only, for reasons that will persist for years.
The installed base is the biggest one. SNMP runs on virtually every device in production today, across every vendor and generation. MDT support is concentrated on newer platforms, primarily recent Cisco IOS-XE, IOS-XR, and NX-OS gear, and it varies by model and software version. Any real network is a mix of new and old, so a monitoring strategy that only speaks MDT is blind to a large part of the estate. Beyond that, many device classes, UPS and PDU units, printers, older switches, and much third-party equipment, expose SNMP and nothing else. And even where MDT is available, it usually has to be configured per device, so SNMP remains the fast path to broad coverage.
This is not a migration from SNMP to MDT. It is a long period of running both: MDT on the newer, faster, denser parts of the network where its resolution matters, SNMP everywhere else. The design problem is not choosing between them. It is making both land in one consistent view.
The Real Problem: Two Formats, One View
Running both telemetry types creates a data-consistency problem. SNMP metrics arrive as OID-based values. MDT arrives as YANG-modeled, streamed structures with entirely different field names: an interface’s inbound byte counter is ifInOctets in SNMP but statistics/in-octets on an IOS-XE YANG path. Point both at a monitoring platform raw and you get two disconnected data sets describing the same interfaces and devices, with no shared vocabulary. Every dashboard, search, and threshold would have to be built twice.
The way out is normalization: mapping both telemetry types to a common set of field names before they reach the analytics layer, so a byte counter is the same field whether it came from an SNMP poll or an MDT stream.
How NFO Handles MDT, and Unifies It With SNMP
NFO receives MDT in dial-out mode: network devices establish a persistent gRPC connection to NFO and stream telemetry to it, using the yang-push stream with kvGPB encoding, delivered periodically or on-change. If a connection drops, the device reconnects automatically. NFO converts the streamed messages to JSON and can deliver them to JSON-compatible destinations including Splunk, Kafka, S3, Azure Blob Storage, and OpenSearch.
The part that unifies MDT with SNMP is NFO’s field normalization. NFO includes a built-in MDT field-normalization table that maps each streamed YANG field to a chosen normalized name. Point it at the same names your SNMP metrics already use, and MDT data arrives in the same shape as the equivalent SNMP data:
| MDT field (YANG path) | Normalized name (matches SNMP) |
| statistics/in-octets | in_bytes |
| memory-statistic/used-memory | mem_used |
| memory-statistic/free-memory | mem_free |
| cpu-utilization/five-minutes | cpu_load_percent |
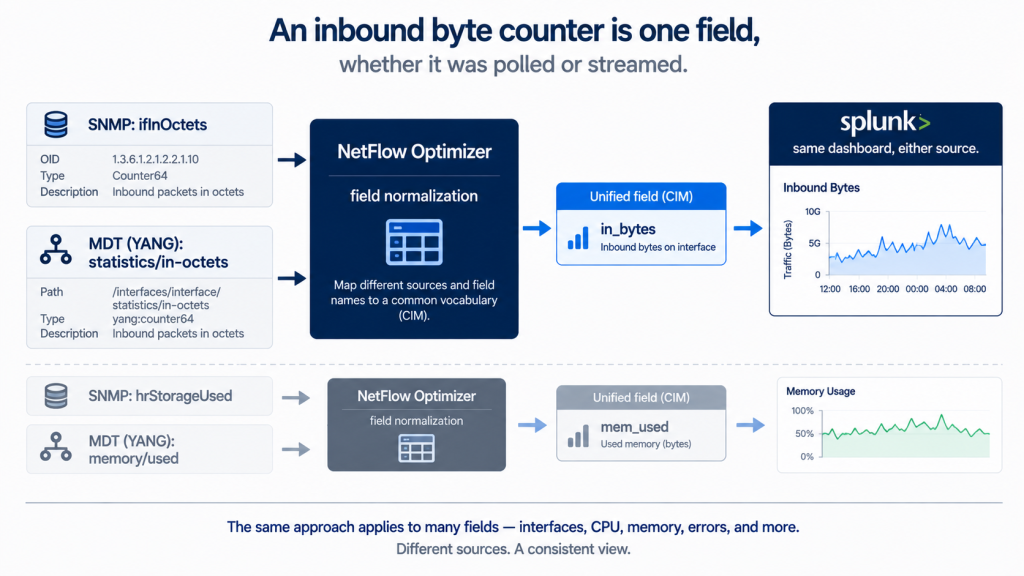
Because the mapping is configurable, you decide how MDT fields align to your existing metric names. Once they do, MDT and SNMP describe devices and interfaces in the same vocabulary, and both can be consumed by the same downstream content. In practice that means MDT data can flow into the existing NetFlow and SNMP Analytics for Splunk app and its dashboards, alongside the SNMP metrics they were built for, rather than requiring a separate, parallel set of dashboards for MDT. On the Splunk side, NFO’s companion apps and technology add-on supply the CIM-compliant field names, event types, and tags, so the normalized telemetry lands ready for the data models Splunk content expects.
As always, NFO’s role is collection and normalization, not analysis. It receives MDT, converts and normalizes it, and delivers it. The dashboards, thresholds, and alerting live in Splunk or whichever platform consumes the output. What NFO removes is the format gap that would otherwise force you to treat MDT and SNMP as two separate worlds.
A Practical Path Forward
For most organizations, the sensible approach is incremental. Keep SNMP as the baseline for broad coverage across the whole estate. Enable MDT on the newer, higher-speed devices where its resolution and efficiency pay off, and where per-device configuration is worth the effort. Normalize both to a common set of field names through NFO, so the two coexist in one consistent view instead of two.
Done this way, adopting MDT is additive rather than disruptive. You gain streaming resolution where it matters without losing visibility anywhere, and without rebuilding your monitoring content around a second data format. SNMP keeps doing what it does well, MDT covers what it does better, and the analytics layer never has to know which one a given metric came from.
The Bottom Line
Model-Driven Telemetry is the modern, push-based successor to SNMP polling: higher-resolution, lower-overhead, and increasingly the direction newer hardware is built for. But SNMP is not going away, because the installed base, the SNMP-only device classes, and the cost of per-device MDT configuration all persist. The practical strategy is both, and the practical challenge is consistency. NFO receives MDT over gRPC, normalizes its fields to the same names as your SNMP metrics, and delivers both to the same analytics layer.
You do not have to choose between the telemetry of the past and the telemetry of the future. You have to make them speak the same language.
Running SNMP today and looking at MDT for your newer devices? Start a free 60-day trial of NetFlow Optimizer or schedule a technical demo with a NetFlow Logic engineer.
Start Free Trial | Schedule a Demo | NetFlow and SNMP Analytics App | NFO Documentation