Ask any network architect about their biggest operational headache, and the response is rarely a single protocol or a specific piece of hardware. Instead, it’s complexity.
Most enterprise networks are dynamic ecosystems resulting from years of phased upgrades, budget cycles, and corporate acquisitions. The typical environment is a heterogeneous “multi-vendor maze,” featuring Cisco core switches, Juniper routers, Palo Alto Networks firewalls, and Fortinet SD-WAN edge devices. This complexity now extends deep into the cloud, with AWS, Azure, Google Cloud (GCP), and Oracle Cloud (OCI) each providing their own distinct telemetry.
This diversity is a strategic advantage for selecting the best tool for the job, but it creates a massive visibility gap. Achieving consistent monitoring across this disparate infrastructure is a significant challenge because every vendor and cloud provider “speaks” a different dialect of telemetry.
The Metadata Gap: Binary Flows vs. Cloud Logs
Network telemetry arrives in two fundamentally different forms, and even within those forms, the data structures vary wildly.
1. On-Premises: The Binary Challenge
Traditional hardware from vendors like Cisco (NetFlow), Juniper (J-Flow), and Palo Alto (IPFIX) exports telemetry in a binary format. Because these flows are encoded as raw bits and bytes to save bandwidth, they do not have human-readable “labels” at the source. The challenge occurs at the ingestion layer: different collectors and SIEMs may interpret these binary fields differently, mapping a source IP to src, src_ip, or source_address depending on the specific parser used.
2. The Cloud: A Fragmentation of Formats
Unlike their on-premises counterparts, Cloud Flow Logs are typically delivered as text-based logs. However, even within the same cloud provider, formats differ, and no two providers use the same schema.
- AWS VPC Flow Logs use a space-delimited or parquet format.
- Azure offers both NSG (Network Security Group) Flow Logs and VNet Flow Logs, each with distinct structures and metadata.
- Google Cloud (GCP) Firewall Logs and Oracle Cloud (OCI) VCN Flow Logs each utilize their own proprietary JSON hierarchies.
The Problem: Without a normalization layer, your analysts must account for these structural differences in every search. Correlating a threat that starts in an on-premises Cisco environment and moves through an Azure VNet into an AWS VPC requires navigating three entirely different data universes.
The Health Gap: SNMP Metrics and Power Devices
While flows tell you about the traffic, SNMP (Simple Network Management Protocol) tells you about the health of the hardware itself.
- Infrastructure Health: Cisco and Juniper use unique OIDs (Object Identifiers) to report CPU / memory utilization, temperature, and other metrics.
- Power & Facilities: Devices like UPS systems (Uninterruptible Power Supplies) report entirely different metrics, such as battery runtime and input voltage. While standards exist, manufacturers like APC (PowerNet) and Eaton/Tripp Lite utilize proprietary OID branches (Private MIBs) for their specific management cards; this means a “battery capacity” OID that works for one vendor will not function for another, creating yet another silo in your infrastructure monitoring.
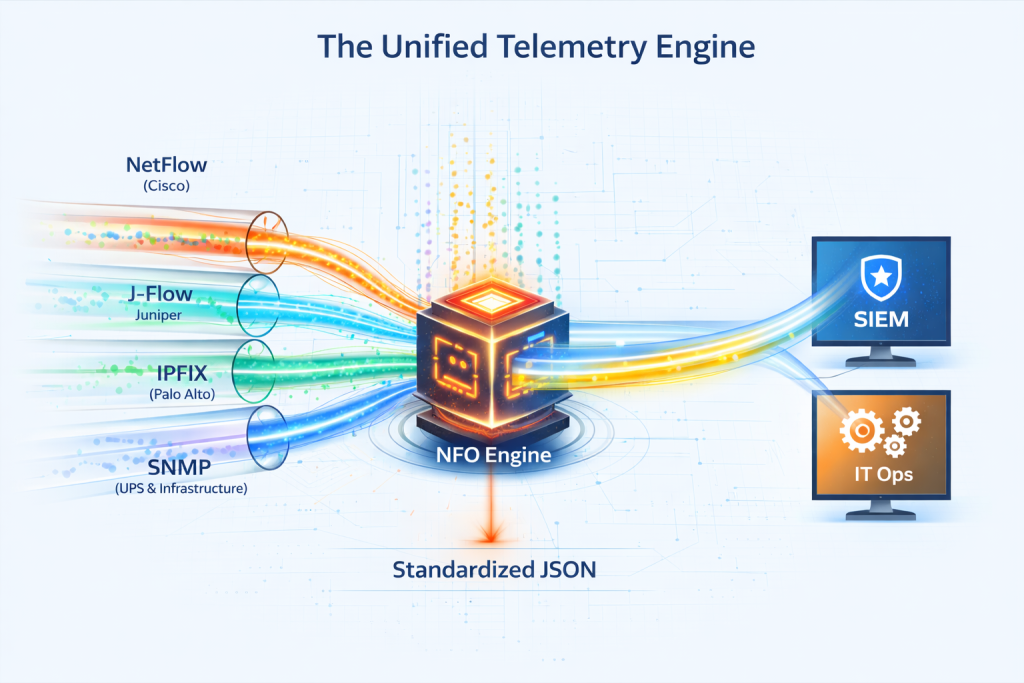
Normalization: The NFO Solution
NetFlow Optimizer (NFO) acts as the “universal translator” that sits in your data pipeline, processing these disparate dialects before they reach your analysis platform.
- Unified Schema for Binary & Cloud: NFO’s greatest value is its ability to ingest both binary hardware flows and text-based cloud flow logs from AWS, Azure, GCP, and OCI, outputting them in the exact same standardized format. Whether the data originated from a Cisco router or an Oracle Cloud VCN, your SIEM receives a consistent field name (e.g., src_ip).
- Health Metric Alignment: NFO polls SNMP metrics from routers, switches, and even UPS power devices, normalizing hardware health into a standardized stream. This allows your monitoring platform, such as Splunk ITSI or equivalents like ServiceNow ITOM and Datadog, to maintain distinct, high-fidelity “Services” for both network throughput and facility power health within the same operational ecosystem.
- High-Fidelity Output: The final, enriched data is sent to your SIEM (like Splunk or Microsoft Sentinel) using a single, high-performance sourcetype, drastically simplifying dashboard creation and incident response.
The Bottom Line: True Unified Visibility
Moving past the multi-vendor maze isn’t about replacing your hardware or consolidating your clouds; it’s about making your telemetry work together. By utilizing NFO as your central normalization hub, you bridge the gap between binary flows and cloud logs, achieving the “single pane of glass” visibility that modern hybrid networks demand.
Ready to stop fighting incompatible data formats and start seeing your entire hybrid network?
Download a Free Trial of NFO or Schedule a Personalized Demowith our team to see how we integrate with your multi-vendor and multi-cloud environment.