
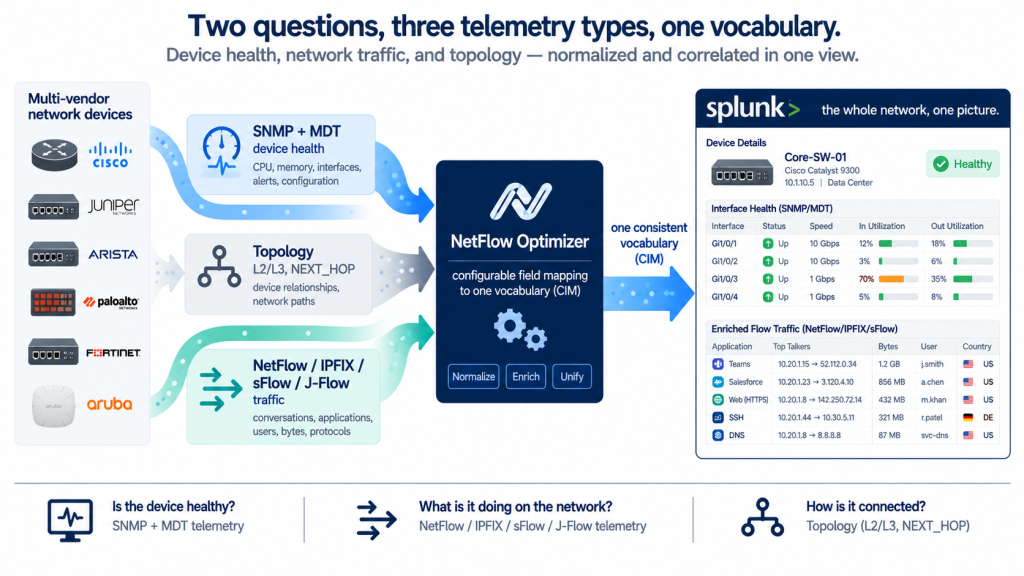
Every network team is really answering two different questions all day long. The first is about the infrastructure: are the devices and interfaces healthy, and where are they under strain? The second is about the traffic: what is actually moving across the network, from whom, to where, and is that what should be happening? Both questions matter, and neither answers the other.
The problem is that these two questions have historically been answered by different tools, speaking different data languages. Device health comes from SNMP polling and, increasingly, streamed Model-Driven Telemetry. Traffic comes from NetFlow, IPFIX, sFlow, and J-Flow. The tools that collect each store it differently, name fields differently, and rarely share a frame of reference. So when a service degrades, joining “this interface is saturated” to “here is exactly what was crossing it, by user and application” becomes a manual reconciliation across systems, usually under pressure.
That reconciliation is the real problem, and it is a data problem, not a collection problem. The answer is to bring both question-types into one consistent vocabulary before they reach the analytics layer. That is what NetFlow Optimizer (NFO) does.
Two Questions, Three Telemetry Types
The two questions map onto three telemetry types, and NFO handles all three, at scale and equally well.
Infrastructure health, from SNMP and MDT.
SNMP polling is the universal baseline: interface status and utilization, errors and discards, device CPU and memory, across essentially every vendor and generation. Model-Driven Telemetry adds the modern, push-based path for devices that support it, streaming the same class of health data at higher resolution and lower overhead. As covered in Beyond SNMP Polling, these are not a migration from one to the other, they are complementary, and NFO ingests both.
Traffic, from NetFlow, IPFIX, sFlow, and J-Flow.
Flow telemetry records the conversations: source, destination, port, protocol, volume, and duration. NFO parses the binary these formats arrive in, which a SIEM cannot ingest raw, and enriches every record with user identity, application, threat intelligence, and geographic context. This is the traffic answer, and it is the layer that says not just that the network is busy, but what it is busy with.
Topology, tying the two together.
NFO’s auto-discovery maps not only the devices but the connections between them, including L2 and L3 relationships and actual traffic paths derived from NEXT_HOP data. Topology is the connective tissue: it is what lets a health signal on one device and the traffic crossing it be understood as part of the same picture rather than two isolated facts.
| Question | Telemetry NFO unifies |
| Is the infrastructure healthy? | SNMP polling and MDT streaming: interface, CPU, memory |
| What is the traffic? | NetFlow, IPFIX, sFlow, J-Flow: enriched conversations |
| How is it all connected? | Auto-discovered topology: L2/L3, NEXT_HOP paths |
NFO’s Value: Making Three Feeds Speak One Language
Collecting three telemetry types is not, by itself, the achievement. Plenty of environments already collect all of them, in separate tools. The achievement is making them consistent, so that a device, an interface, or a conversation means the same thing regardless of which telemetry type it came from.
Left raw, the three speak different languages. An inbound byte counter is one thing in an SNMP OID, another in an MDT YANG path, and another again in a flow record. A device is identified one way by its poller and another by its flow exporter. Point all of that at Splunk unprocessed and you get three disconnected data sets describing the same network, and every dashboard, search, and correlation has to be built and maintained three times.
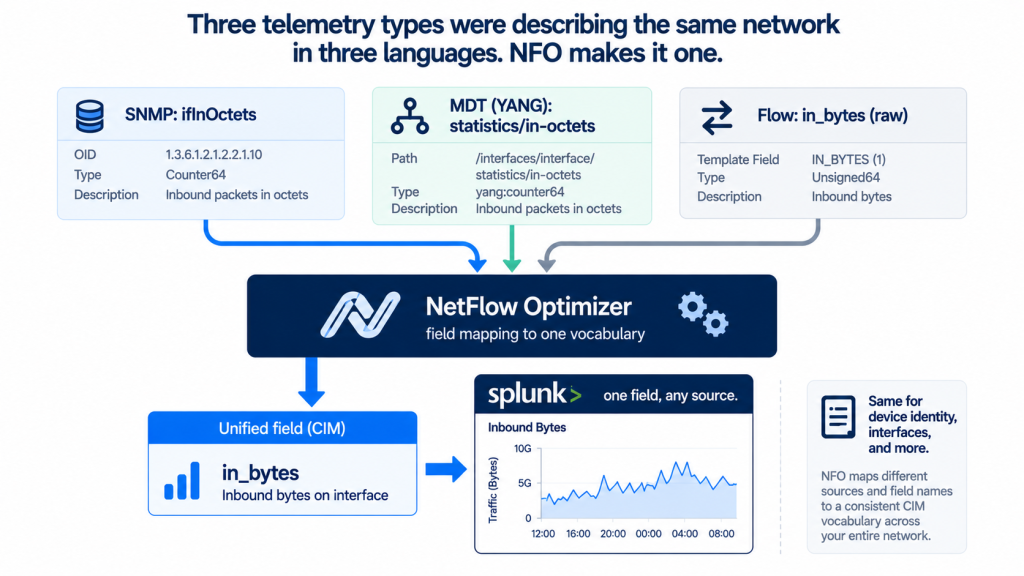
NFO closes that gap with configurable field mapping across all three telemetry types, aligning them to a common set of names. Whatever the source, a given metric or entity arrives in Splunk under one consistent vocabulary. On the Splunk side, NFO’s technology add-on can further align fields to the Common Information Model, so the normalized telemetry lands ready for the data models Splunk content expects.
Collecting SNMP, MDT, and NetFlow is not the hard part. Making them describe the same network in the same terms is. NFO normalizes all three, plus topology, to one vocabulary, so infrastructure health and traffic become answerable in one place instead of reconciled across three.
What One Vocabulary Makes Possible
When all three telemetry types share a frame of reference, the two questions stop being separate investigations. The payoff is correlation that would otherwise be manual.
- Health explained by traffic. An interface showing rising discards, and immediately alongside it the enriched flows that were crossing it, which users, which applications, which destinations, at that moment.
- Traffic understood in context. A volume spike to an external destination, seen together with the health of every device along the path topology reveals it took.
- One model across collection methods. A device streaming MDT and a device polled over SNMP appear the same way in the service model, so coverage is uniform even while the underlying collection is mixed.
The detection, correlation, alerting, and visualization all happen downstream, in Splunk or whichever platform consumes the output. NFO does not analyze or alert. What it does is ensure that when those workflows run, they run on one coherent picture of the whole network, health, traffic, and topology, rather than three partial ones that have to be stitched together first.
The Bottom Line
Network teams answer two questions all day: is the infrastructure healthy, and what is the traffic doing? Those questions live in three telemetry types, SNMP, MDT, and flow, that have always spoken different languages in different tools. NFO collects all three at scale, discovers the topology that connects them, and normalizes everything to one vocabulary, so the whole network becomes answerable in one place.
Collecting the data was never the hard part. Making it speak one language is, and that is what turns three separate feeds into a single, coherent picture of the network.
Want SNMP, MDT, and NetFlow unified in one vocabulary in Splunk? Start a free 60-day trial of NetFlow Optimizer or schedule a technical demo with a NetFlow Logic engineer.
Start Free Trial | Schedule a Demo | Splunk Integration | NFO Documentation