Network flow data — NetFlow, IPFIX, sFlow — is among the most valuable telemetry available to security and network operations teams. It is also, in its raw form, almost impossible to operationalize in Splunk.
The reason is not a Splunk limitation. It is a data reality: raw NetFlow is binary, extremely high-volume, and completely un-enriched. A mid-sized enterprise network can generate tens of gigabytes of raw flow records every day. Those records contain IP addresses, port numbers, and byte counts — no usernames, no application names, no threat context. Ingesting that volume of binary, context-free data into Splunk at scale is operationally impractical and analytically unrewarding.
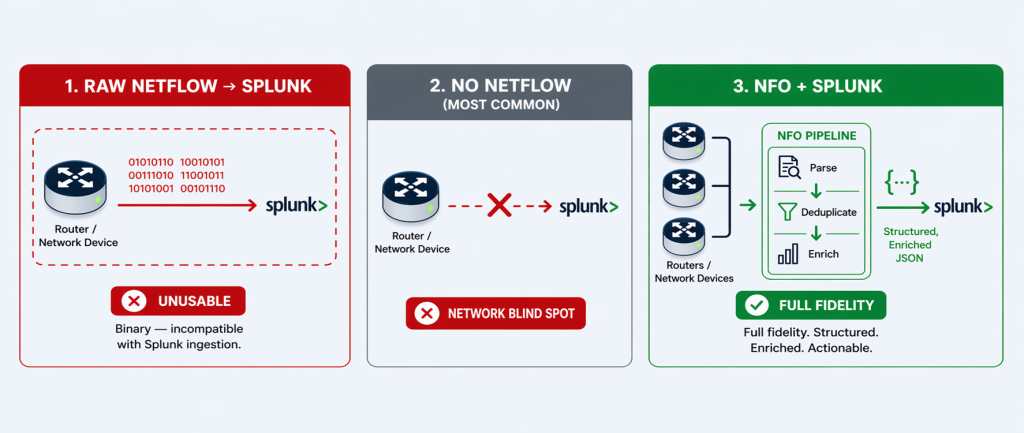
This is why the vast majority of organizations running Splunk today have made a simple, pragmatic decision: they do not ingest NetFlow into Splunk at all. Not because they don’t recognize its value — but because the raw format makes it unworkable.
This is the problem NetFlow Optimizer (NFO) solves. NFO transforms raw, binary, un-enriched NetFlow into a clean, structured, identity-enriched telemetry stream that is purpose-built for Splunk ingestion. The result is not a trade-off between cost and visibility — it is a capability that simply did not exist in Splunk before NFO was deployed.
The Real Choice: NFO-Optimized NetFlow, or No NetFlow at All
It is tempting to frame network flow data as a cost problem — too much volume, too expensive to ingest. But for most Splunk environments, the actual situation is more fundamental than that. The question is not how to reduce NetFlow volume in Splunk. The question is how to get any NetFlow into Splunk in a usable form.
Raw NetFlow presents three characteristics that make it impractical to ingest directly:
1. It Is Binary
NetFlow records are exported from routers and switches in a compact binary format — specifically designed for efficient network transmission, not for human-readable analysis. Splunk cannot ingest binary data. Raw NetFlow exports from routers and switches are binary — which means without an external processing layer to decode and convert them first, NetFlow simply never enters the Splunk index at all.
2. It Is Extremely High-Volume
A single enterprise-grade router can generate tens of thousands of flow records per second. Across a distributed network with dozens of routers, switches, and firewalls — each reporting NetFlow for every conversation they handle — the aggregate daily volume runs into hundreds of gigabytes for a mid-sized enterprise and terabytes for large government or enterprise environments. This volume is not a sign of data richness; it reflects the raw, unprocessed state of the data before duplication is removed and conversations are consolidated.
Critically, much of this volume is redundant by design. When a single packet crosses three switches on its way to its destination, all three switches generate a NetFlow record for the same conversation. The same conversation is reported three times. This multi-hop duplication, combined with the ingress/egress double-reporting common in many router configurations, means that raw NetFlow volume often overstates the actual number of unique network conversations by a factor of three to five.
3. It Is Un-Enriched
A raw NetFlow record identifies endpoints by IP address. It does not tell you who was using that IP address, what application generated the traffic, whether the destination is known to be malicious, or what country the external connection reached. In a Splunk environment built for security detection and investigation, a data source that delivers only IP addresses and byte counts requires significant additional processing — lookup tables, joins, enrichment pipelines — before it produces anything an analyst can act on. For most organizations, that processing overhead is the final barrier that makes raw NetFlow impractical in Splunk.
The practical outcome of these three characteristics is consistent across organizations: network teams recognize the value of flow data, evaluate ingesting it into Splunk, conclude that the raw format is unworkable, and abandon the effort. The network visibility layer that Splunk could provide simply goes unrealized.
What NFO Does: Transforming Raw NetFlow into Splunk-Ready Telemetry
NFO sits between your network infrastructure and Splunk as a dedicated telemetry processing pipeline. It receives raw, binary NetFlow exports directly from your routers, switches, and firewalls — the same devices that are already generating flow data, whether or not that data is currently being used. NFO then applies three transformation steps before delivering a clean, structured stream to Splunk. Full technical details are in the NFO documentation.
1. Parse and Normalize: From Binary to Splunk-Ready JSON or Syslog Key=Value
NFO decodes raw binary NetFlow records — across all major formats including NetFlow v5, v9, IPFIX, sFlow, and J-Flow — and normalizes them into structured, CIM-compliant output delivered to Splunk as either JSON or syslog key=value pairs, depending on your deployment preference. This single step transforms an incompatible binary stream into indexed, searchable Splunk data. Every field — source IP, destination IP, protocol, port, byte count, duration — becomes a discrete, queryable Splunk field the moment it lands in the index.
2. Aggregate, Deduplicate, and Stitch: Eliminate Redundancy, Preserve Fidelity
NFO applies three complementary techniques to reduce the volume of flow data delivered to Splunk — without discarding any analytically valuable information.
Aggregation is the primary volume reduction mechanism. NFO combines flows that share the same key attributes — source, destination, protocol, and port — into a single summarized record, dramatically reducing record count while preserving the full picture of network activity.
Deduplication eliminates the multi-hop redundancy inherent in enterprise networks. When the same conversation is reported independently by multiple devices — an access switch, a distribution switch, and a core router — NFO identifies these as perspectives on the same flow and consolidates them into one authoritative record.
Flow stitching reconstructs bidirectional conversations from separate ingress and egress records, replacing two half-records with a single complete entry that includes full byte counts, duration, and directional context in both directions.
The combined effect of these three techniques is what makes full-fidelity NetFlow in Splunk sustainable — not by discarding data, but by eliminating the structural redundancy that inflates raw volume without adding analytical value. For a detailed technical breakdown of how each technique works, see the NFO Volume Reduction Guide.
3. Enrich: Add the Context That Makes NetFlow Actionable
This is the step that transforms NetFlow from a network metric into a security and operations intelligence source. NFO’s enrichment engine performs sub-millisecond lookups against in-memory tables, appending contextual metadata to every flow record before it reaches Splunk. The result is data that answers not just what happened but who, where, and whether it matters.
Before each flow record reaches Splunk, NFO enriches it with:
- User Identity: Real-time correlation with Active Directory, Okta, or Microsoft Entra ID maps every source IP to the authenticated user account behind it. Splunk receives a named user — not an IP address — from the moment the record is indexed, eliminating the need for identity lookups at query time.
- Application Name: NFO leverages the deep packet inspection (DPI) and application classification engines built into your existing network devices — Cisco NBAR2, Palo Alto App-ID, Fortinet FortiOS, and SonicWall — to add layer-7 application context to every flow record. Rather than resolving port numbers to guessed application names, NFO receives the application name as classified by the device itself, maps it to a normalized application field, and delivers it to Splunk. The result is accurate, vendor-neutral application visibility across your entire infrastructure: analysts work with “Salesforce,” “Office 365,” or “BitTorrent” rather than anonymous port/protocol pairs — including for SSL-encrypted traffic where port-based resolution would fail entirely. For configuration details by device vendor, see the NFO Application Enrichment documentation.
- Cyber Threat Intelligence: Every flow is cross-referenced in real-time against curated reputation feeds to detect communication with botnets, malware distributors, and TOR exit nodes. Threat feed updates are pulled automatically, ensuring detections keep pace with the current threat landscape.
- GeoIP and ASN: Country, city, latitude/longitude, and Autonomous System Number data for every destination is embedded in the record, enabling geographic filtering, alerting on traffic to sanctioned regions, and compliance reporting — without a Splunk lookup table.
- VM and Cloud Infrastructure Context: In dynamic environments where IP addresses change frequently, NFO integrates with VMware vCenter and cloud providers to map transient IPs to persistent virtual machine names and tags — maintaining accurate security logs even as VMs migrate across hosts.
- Reverse DNS (FQDN): IP addresses are resolved to hostnames using your existing DNS infrastructure, replacing abstract addresses with recognizable internal names (e.g., hr-portal-prod.local) that simplify both security investigation and IT operations troubleshooting.
The enriched record that arrives in Splunk is categorically more useful than the raw record that would have arrived without NFO. It is immediately searchable by user, application, destination country, threat score, and hostname. Splunk Enterprise Security correlation searches can run against it without additional lookup joins, and dashboards render instantly with named users and applications rather than IP addresses. For full enrichment configuration details, see the NFO Data Enrichment documentation.
What This Means for Splunk: A New Data Source, Not a Smaller One
This is the critical point for Splunk customers and Splunk partners alike: NFO does not reduce the value of data flowing into Splunk. It creates a data flow that would not exist otherwise.
For the overwhelming majority of organizations that engage with NetFlow Logic, the starting point is the same: Splunk is running, endpoint and authentication logs are indexed, and NetFlow is being generated by network infrastructure — but never reaching Splunk. The network layer is a complete blind spot in the Splunk environment.
NFO changes that. When an organization deploys NFO, Splunk gains an entirely new class of telemetry — enriched network flow data — that it was not receiving before. This is new indexed data, new search capability, new detection coverage, and new dashboard visibility that the Splunk deployment did not have prior to NFO.
| Scenario | NetFlow in Splunk | Splunk Value Delivered |
| Raw NetFlow → Splunk direct | Not possible — Splunk cannot ingest binary data | None — the data is incompatible at the ingestion level |
| Router-level sampling | Degraded — low-volume threats invisible | Partial — detection gaps undermine security posture |
| No NetFlow ingestion (most common today) | None | None — network layer is a complete blind spot |
| NFO + Splunk | Full fidelity, enriched, structured — immediately usable | Complete — new network visibility layer, new detection capability, new compliance evidence |
The practical implication is straightforward: NFO-enabled NetFlow ingestion is additive — it brings a data source to Splunk that simply wasn’t there before. And because NFO’s aggregation, deduplication, and stitching pipeline removes structural redundancy before the data reaches Splunk, the volume that lands in your index is a fraction of what raw NetFlow would have required. Organizations are ingesting a lean, enriched, high-fidelity stream — sized for what your network actually does, not for the overhead of how routers happen to report it. The additional Splunk index volume is modest and directly offset by the detection capability, compliance evidence, and forensic visibility it unlocks.
What Splunk Customers Gain: Detection Capabilities That Didn’t Exist Before
With NFO-enriched NetFlow indexed in Splunk, security and network operations teams gain a set of capabilities that are simply unavailable without network flow telemetry — regardless of how many other data sources are already in Splunk.
- East-West Lateral Movement Detection: Endpoint logs and authentication events record what happened on a device. They do not record the network conversations between devices. NFO’s flow telemetry gives Splunk ES the network-layer data it needs to detect an attacker moving laterally between internal segments — a detection gap that no endpoint-only data source can close.
- Data Exfiltration Detection: Large or sustained outbound data transfers to unexpected external destinations appear immediately in flow telemetry as anomalous volume patterns. Without network flow data in Splunk, this class of detection is unavailable.
- Network Baseline and Anomaly Detection: Flow data enables Splunk to build a behavioral baseline of normal network communication patterns and detect deviations — new destinations, unusual protocols, off-hours transfers — that represent early indicators of compromise.
- Compliance Evidence for Network Controls: Frameworks including CMMC 2.0, NIST SP 800-171, and FISMA require continuous monitoring of network communications. Enriched flow telemetry in Splunk provides the audit-ready, user-attributed network communication records that assessors require — evidence that no other Splunk data source can supply.
For more on specific detection use cases enabled by NFO + Splunk, see The Network Layer CrowdStrike Can’t See, The Ransomware “Pre-Flight” Check, and CUI on the Wire.
The Bottom Line: NFO Brings Network Telemetry to Splunk for the First Time
Network flow data is the telemetry layer that tells you what is moving across your network — who is talking to whom, on what application, at what volume, and whether the destination is trustworthy. It is the data source that closes the lateral movement gap, enables exfiltration detection, and provides the network-layer audit trail that compliance frameworks require.
For most organizations running Splunk today, that telemetry layer is missing. Not because the data does not exist — it does, on every router and switch in the environment — but because raw NetFlow in its binary, un-enriched form cannot be operationalized in Splunk without a processing layer between the network and the index.
NFO is that processing layer. It does not give Splunk less network data. It gives Splunk network data for the first time — structured, enriched, and immediately usable — closing the visibility gap that no other data source in the Splunk environment addresses.
Ready to add network telemetry to your Splunk environment? Schedule a technical demo with a NetFlow Logic engineer to see NFO and Splunk delivering enriched network flow visibility, or start a free 60-day trial and index your first enriched NetFlow data in under an hour.
Start Free Trial | Schedule a Demo | Splunk Integration Details | NFO Documentation