
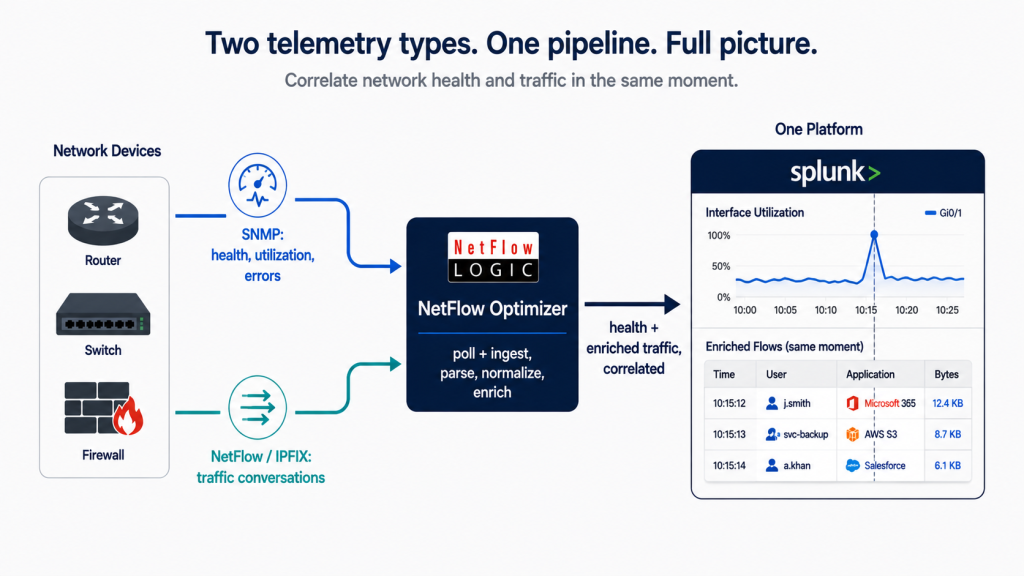
Network teams have long lived with two separate views of the same network. One comes from SNMP: interface status, utilization, error and discard counts, CPU and memory on the device itself. The other comes from flow data: NetFlow, IPFIX, sFlow, and J-Flow records showing which conversations are actually crossing the network. Both are essential. They are usually collected by different tools, stored in different places, and stitched together by hand when something goes wrong.
That separation is a problem at the exact moment it matters most. When an interface starts discarding packets or an application slows down, the first question is always the same: what is the device doing, and what traffic is going through it? Answering that means correlating the health view with the traffic view. If those two live in different systems, the correlation is a manual, slow scramble across tools during an active incident.
It does not have to be. A single pipeline can collect both SNMP and flow telemetry, enrich the flow data, and deliver both, correlated, to the same downstream platform. That is what NetFlow Optimizer (NFO) does.
Two Telemetry Types, Two Different Questions
SNMP and flow data answer different questions, and neither is complete without the other.
SNMP answers: how is the device, and how is the interface?
Polling a router, switch, or firewall over SNMP returns the state of the device and its interfaces: is the interface up or down, how saturated is it, how many errors and discards is it accumulating, how hard are the CPU and memory working. This is the health and capacity view. It tells you that interface GigabitEthernet0/3 is running at 94% utilization with rising output discards. It does not tell you what traffic is causing that.
Flow data answers: what traffic is actually crossing the network?
NetFlow and its variants record the conversations: source and destination, protocol, volume, and duration. Enriched, each record also carries user identity, application name, threat intelligence, and geographic context. This is the traffic view. It tells you which users and applications are generating the load. On its own, it does not tell you whether the underlying interface is healthy or saturated.
The operational questions that matter most sit precisely at the intersection. Which flows were traversing the interface when the discards spiked? Is the CPU climbing because of a legitimate application surge or something anomalous? Did the link saturation coincide with a specific user, application, or destination? None of these can be answered from one telemetry type alone.
SNMP tells you the interface is saturated and discarding. Flow data tells you which enriched conversations were crossing it at that moment. The answer to almost every real network question lives in the correlation of the two, not in either one by itself.
Why the Correlation Usually Does Not Happen
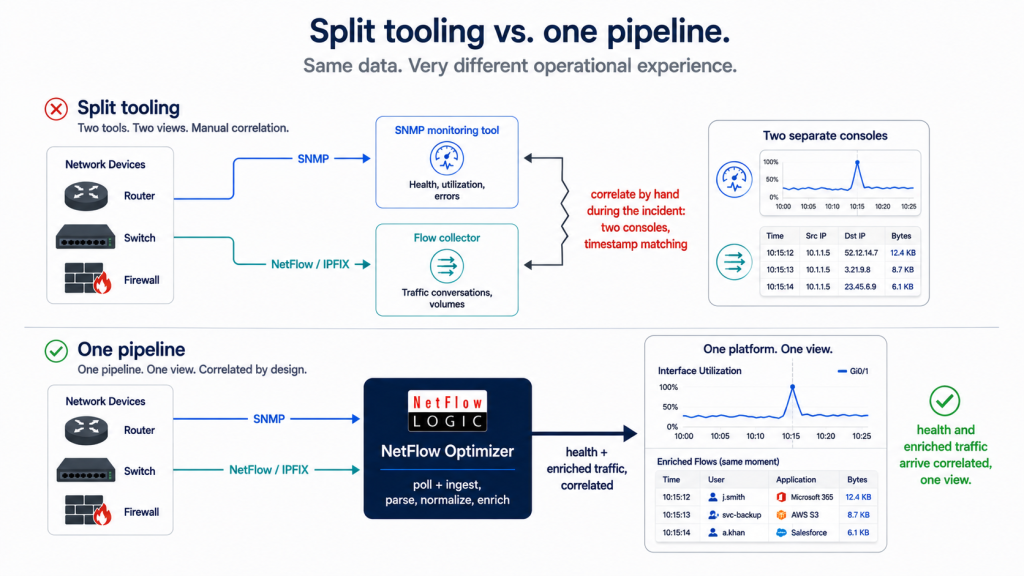
Most environments collect both telemetry types, but through separate tooling. An SNMP-based monitoring platform polls device health. A separate flow collector, if one exists at all, handles NetFlow. The two data sets end up in different systems, with mismatched device naming and no shared context, so lining them up means manually reconciling one against the other.
Correlating them then becomes a manual exercise, usually performed under pressure during an incident. An engineer sees the utilization alarm in the monitoring tool, then pivots to the flow tool (or to raw NetFlow that a SIEM cannot even parse), tries to line up timestamps, tries to match interface identifiers to flow records, and assembles the picture by hand. It is slow, error-prone, and dependent on the engineer knowing where both data sets live and how to join them.
There is also a coverage problem underneath. Device inventories drift. New switches and routers appear, others are decommissioned, and the list of what is actually being polled falls out of date. If a device is not in the inventory, neither its health nor its traffic is being watched.
One Pipeline for Both
NFO collects both telemetry types in a single pipeline. It polls network devices over SNMP for health and interface metrics, and it ingests the binary NetFlow, IPFIX, sFlow, and J-Flow those same devices export. It parses and normalizes both, enriches the flow records with user identity, application, threat intelligence, and geographic context, and delivers both streams to the same downstream platform in a consistent, structured, CIM-compliant format.
Because both telemetry types come from one pipeline, they arrive with a shared frame of reference: consistent device identity, consistent timestamps, ready to be correlated in the destination platform rather than reconciled by hand. When an interface shows rising discards, the enriched flow records for that same device and interface, at that same moment, are right alongside it.
| SNMP from NFO | NetFlow from NFO |
| Interface up/down, utilization | Which conversations crossed the interface |
| Error and discard counts | User and application behind the traffic |
| Device CPU and memory | Volume, duration, destination, threat context |
| Health and capacity view | Enriched traffic view |
NFO’s SNMP auto-discovery keeps the device inventory current so the coverage gap does not open in the first place. As covered in How NFO’s SNMP Auto-Discovery Eliminates Inventory Blind Spots, the pipeline finds and begins polling devices automatically rather than relying on a manually maintained list. Health and traffic telemetry stay aligned to the same, current set of devices.
SNMP polling is also not limited to interface counters and CPU or memory. NFO can collect temperature, fan speed, UPS and PDU power metrics, and other device-specific SNMP values, delivering them alongside flow data to the downstream platform.
As with everything NFO does, the correlation, alerting, and visualization happen in the downstream platform. NFO collects, parses, normalizes, enriches, and delivers both telemetry types in a form that makes correlation straightforward. The dashboards and alert logic live in Splunk, an ITSI content pack, or whichever monitoring and analytics platform the team already uses.
What This Looks Like in Practice
Consider a common scenario. An application team reports intermittent slowness. In a split-tooling environment, the network team checks the SNMP monitoring tool, sees elevated utilization and discards on a particular uplink, then separately hunts through flow data to figure out what was on that link. Two tools, two consoles, manual timestamp matching, and a delay while the picture is assembled.
With both telemetry types delivered from one pipeline into one platform, the same investigation is a single correlated view. The interface health metrics and the enriched flow records for that interface sit together. The team sees the discards, and immediately alongside them the specific enriched flows, which users, which applications, which destinations, that were saturating the link. Capacity planning improves for the same reason: utilization trends and the traffic composition driving them are visible in one place, not two.
The Bottom Line
Device health and network traffic are two views of the same network, and the questions that matter most live in the correlation between them. Collecting SNMP and flow telemetry through separate tools forces that correlation to happen by hand, under pressure, during incidents. NFO collects both in one pipeline, enriches the flow data, keeps the device inventory current through auto-discovery, and delivers both streams, aligned and structured, to the platform where correlation, alerting, and visualization happen.
Health and traffic, from one pipeline, ready to be seen together. That is the difference between reconciling two data sets during an outage and simply looking at the answer.
Want device health and enriched traffic telemetry from a single pipeline? Start a free 60-day trial of NetFlow Optimizer or schedule a technical demo with a NetFlow Logic engineer.
Start Free Trial | Schedule a Demo | Splunk Integration | NFO Documentation